Pathway diagrams for your omics results, drawn from the published literature.
Each shown connection links to its paper or book. Where we have it, you can read the sentence it comes from.
The demo is free and needs a code: ask us at hello@anvesh.app.
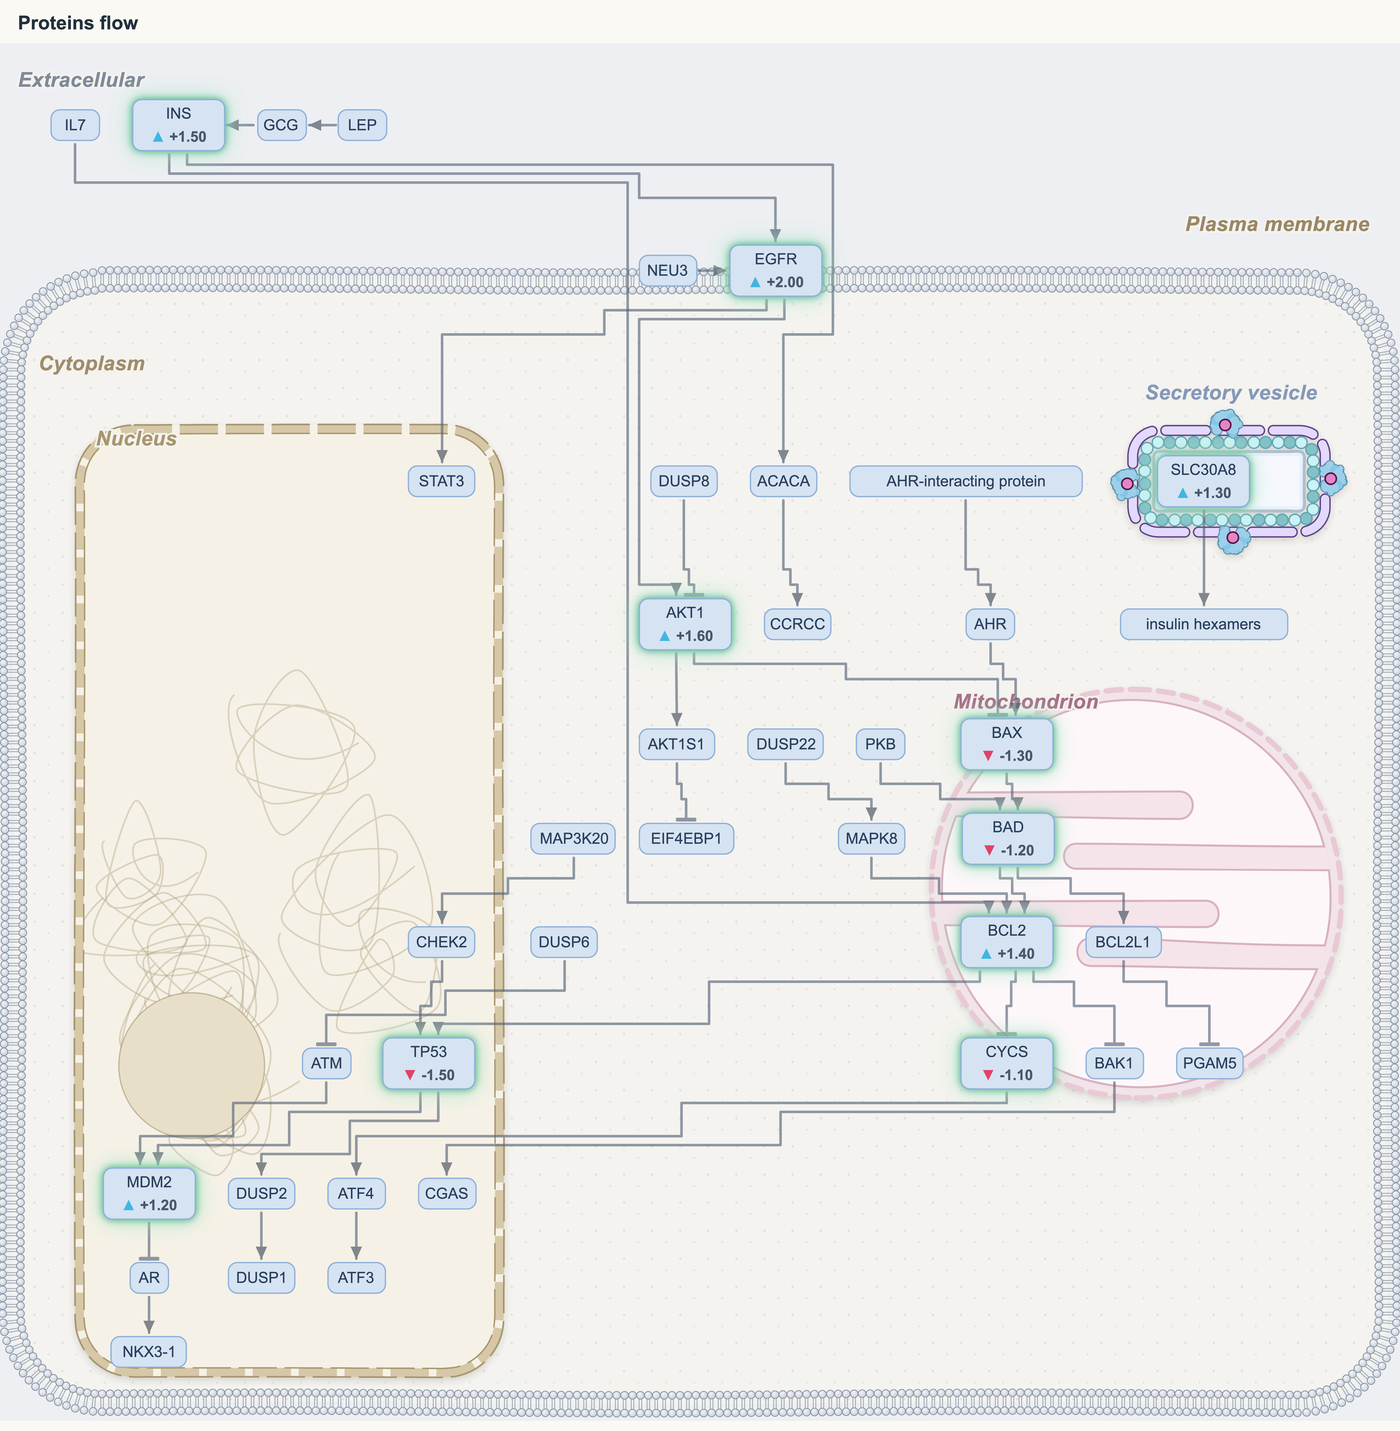
Exported from the Anvesh app (Illustrated cell view); each connection as listed in its connections table.
One way of seeing every kind of omics data
Each page shows a real diagram from the app.
Recorded from the Anvesh app: click an arrow, see its row, open its paper on PubMed.
Proteomics
Paste your significant proteins. Anvesh draws each one with its upstream regulators and downstream effectors, so you see where it sits in the signalling cascade.
Recorded from the Anvesh app: click an arrow, see its row, open its paper on PubMed.
Phosphoproteomics
Paste phosphosites. Anvesh places each site on its protein and draws the kinases reported to act on it; a separate tab draws the phosphatases.
Recorded from the Anvesh app: click an arrow, see its row, open its paper on PubMed.
Metabolomics
Paste your metabolites or lipids, with fold-changes if you have them. Anvesh draws the reactions that connect them, with the enzyme on each arrow, so you see where in a pathway the change sits.
Recorded from the Anvesh app: click an arrow, see its row, open its paper on PubMed.
Lipidomics
Lipids measured as species are listed inside their class box, each with its own value.
Tracer metabolomics
Anvesh shows the values you supply. It does not correct for natural isotope abundance or calculate fluxes.
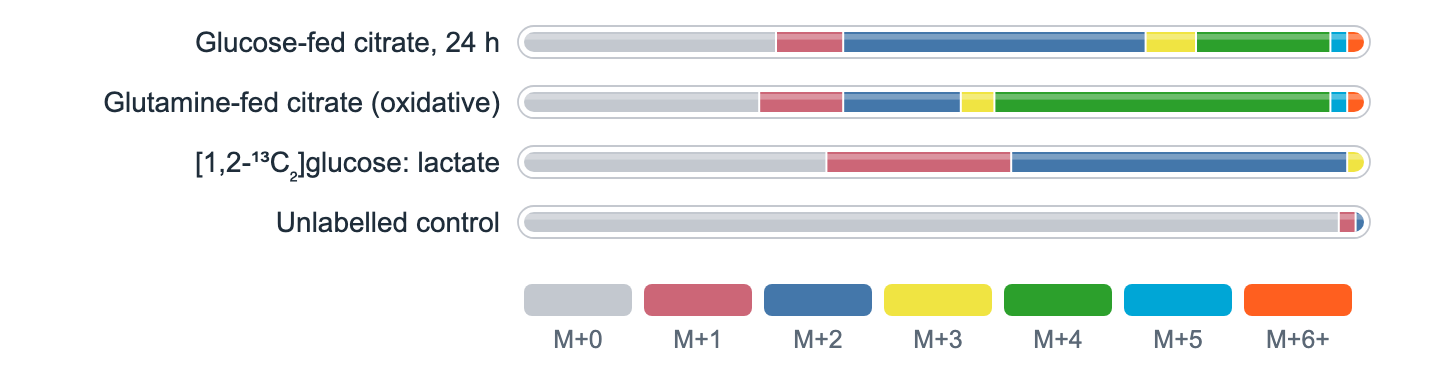
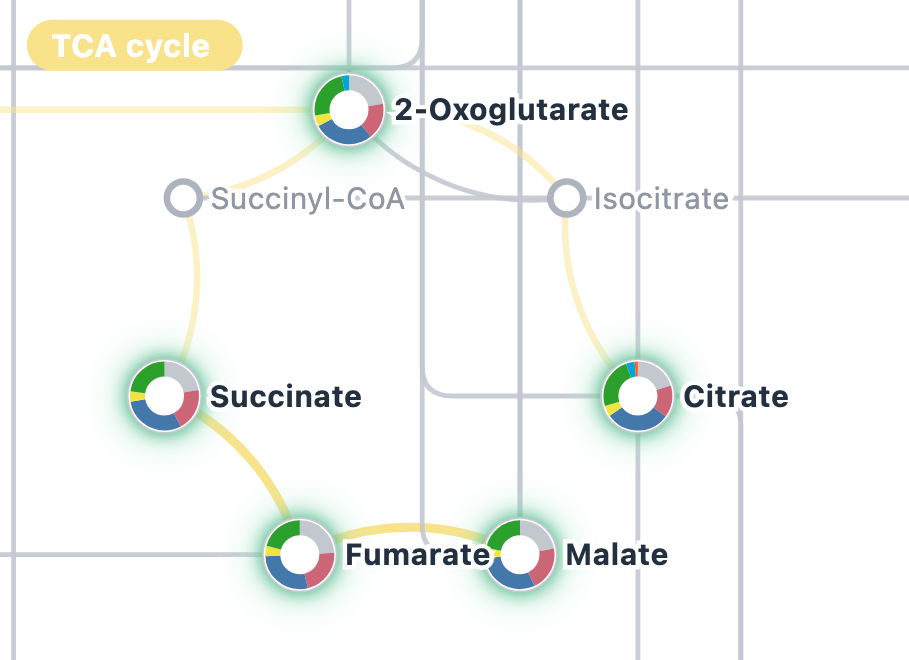
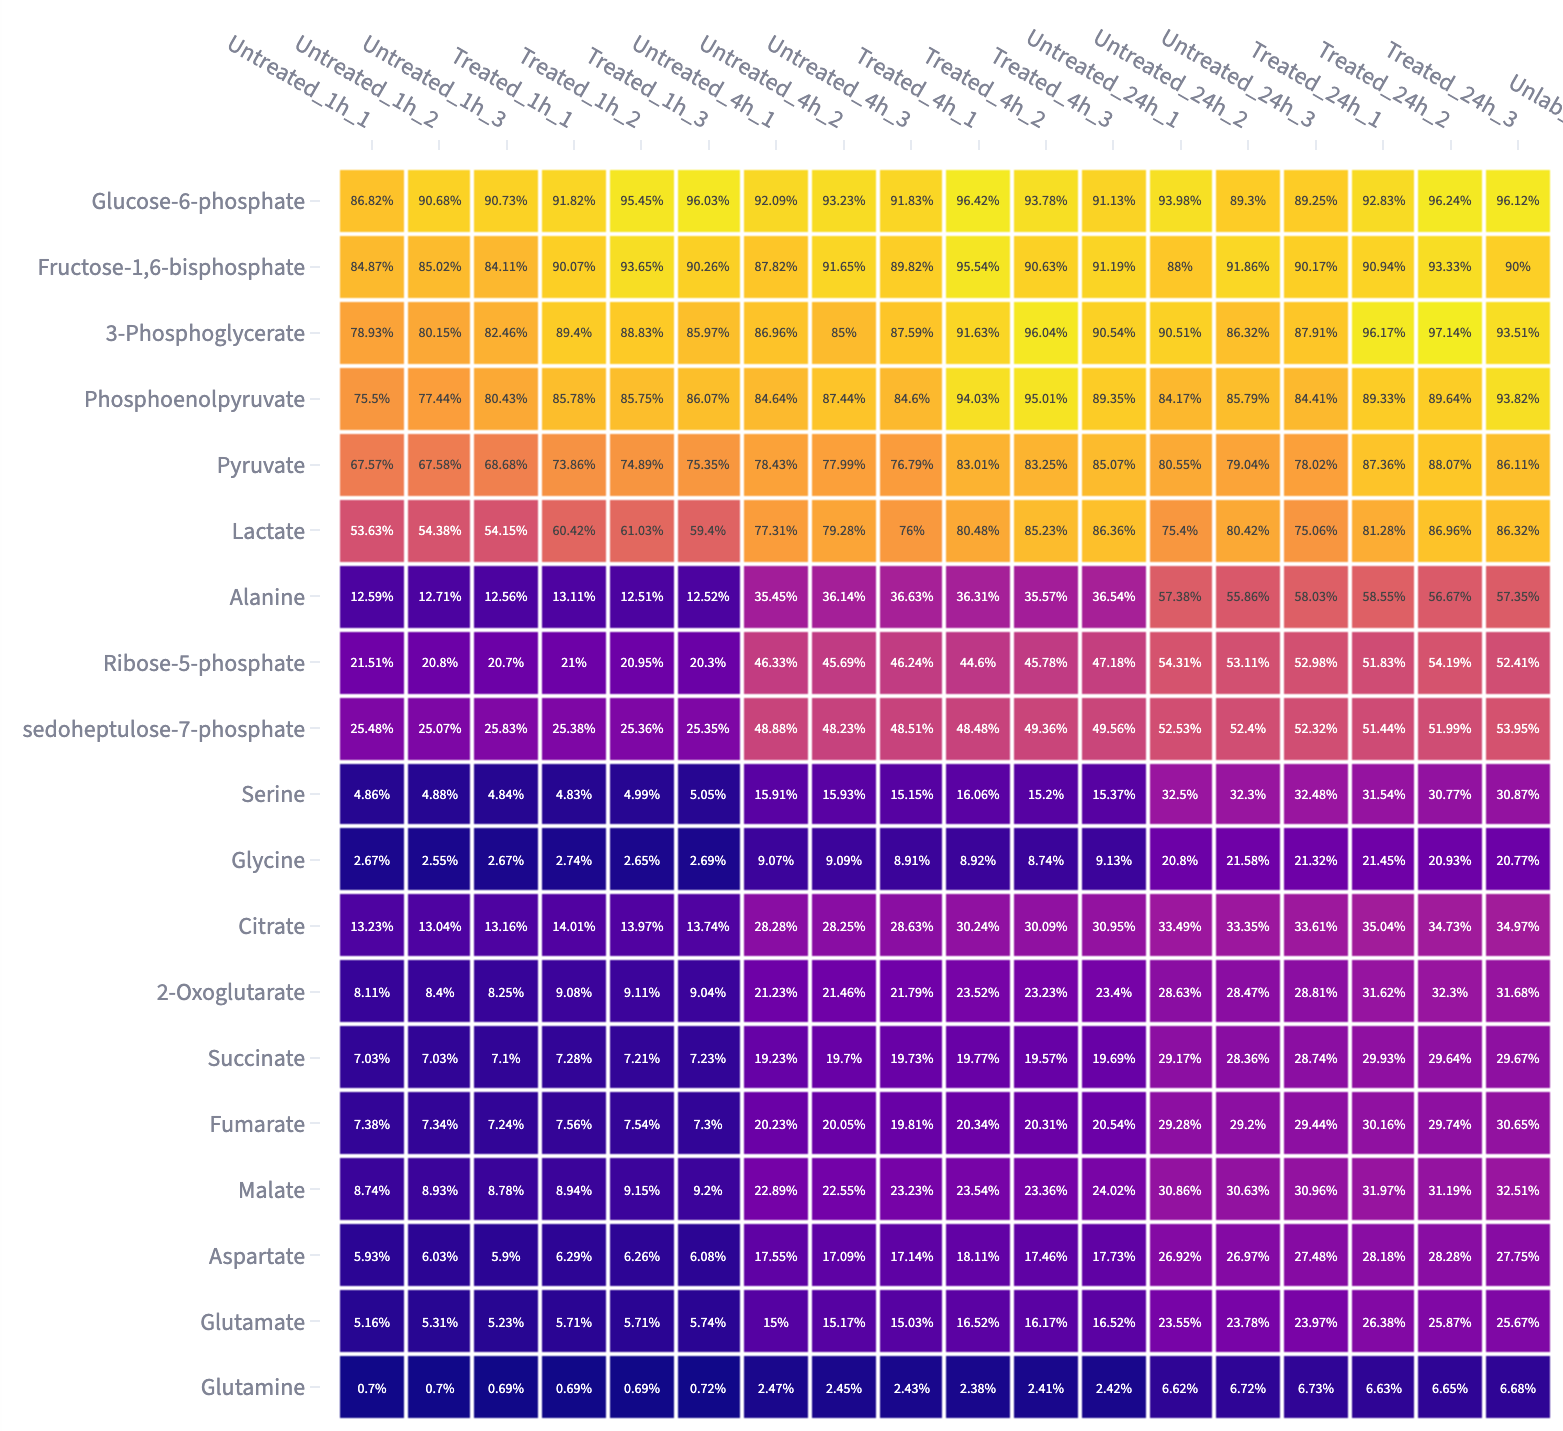
Example values, not from any study.
Recorded from the Anvesh app: click an arrow, see its row, open its paper on PubMed.
Disease areas
Tabs for oncology, cardiovascular disease and diabetes keep results within that disease context, including the treatment drugs linked to the pathway in the literature.
Recorded from the Anvesh app: click an arrow, see its row, open its paper on PubMed.
Plants and crops
A separate plant section covers crop species, with plant compartments such as the cell wall and chloroplast.
Reads exports from Spectronaut, MaxQuant and DIA-NN, or a pasted list of molecules with fold-changes.
From your list to the paper behind each arrow
From your list of significant molecules to a cited, directional diagram you can share.
EGFR, 2.0
GRB2, 1.4
SOS1, 1.2
HRAS, 1.3
RAF1, 1.1
MAP2K1, 1.5
MAPK1, 1.8
Your list
a list of names with fold-changes, or an upload of your results table.
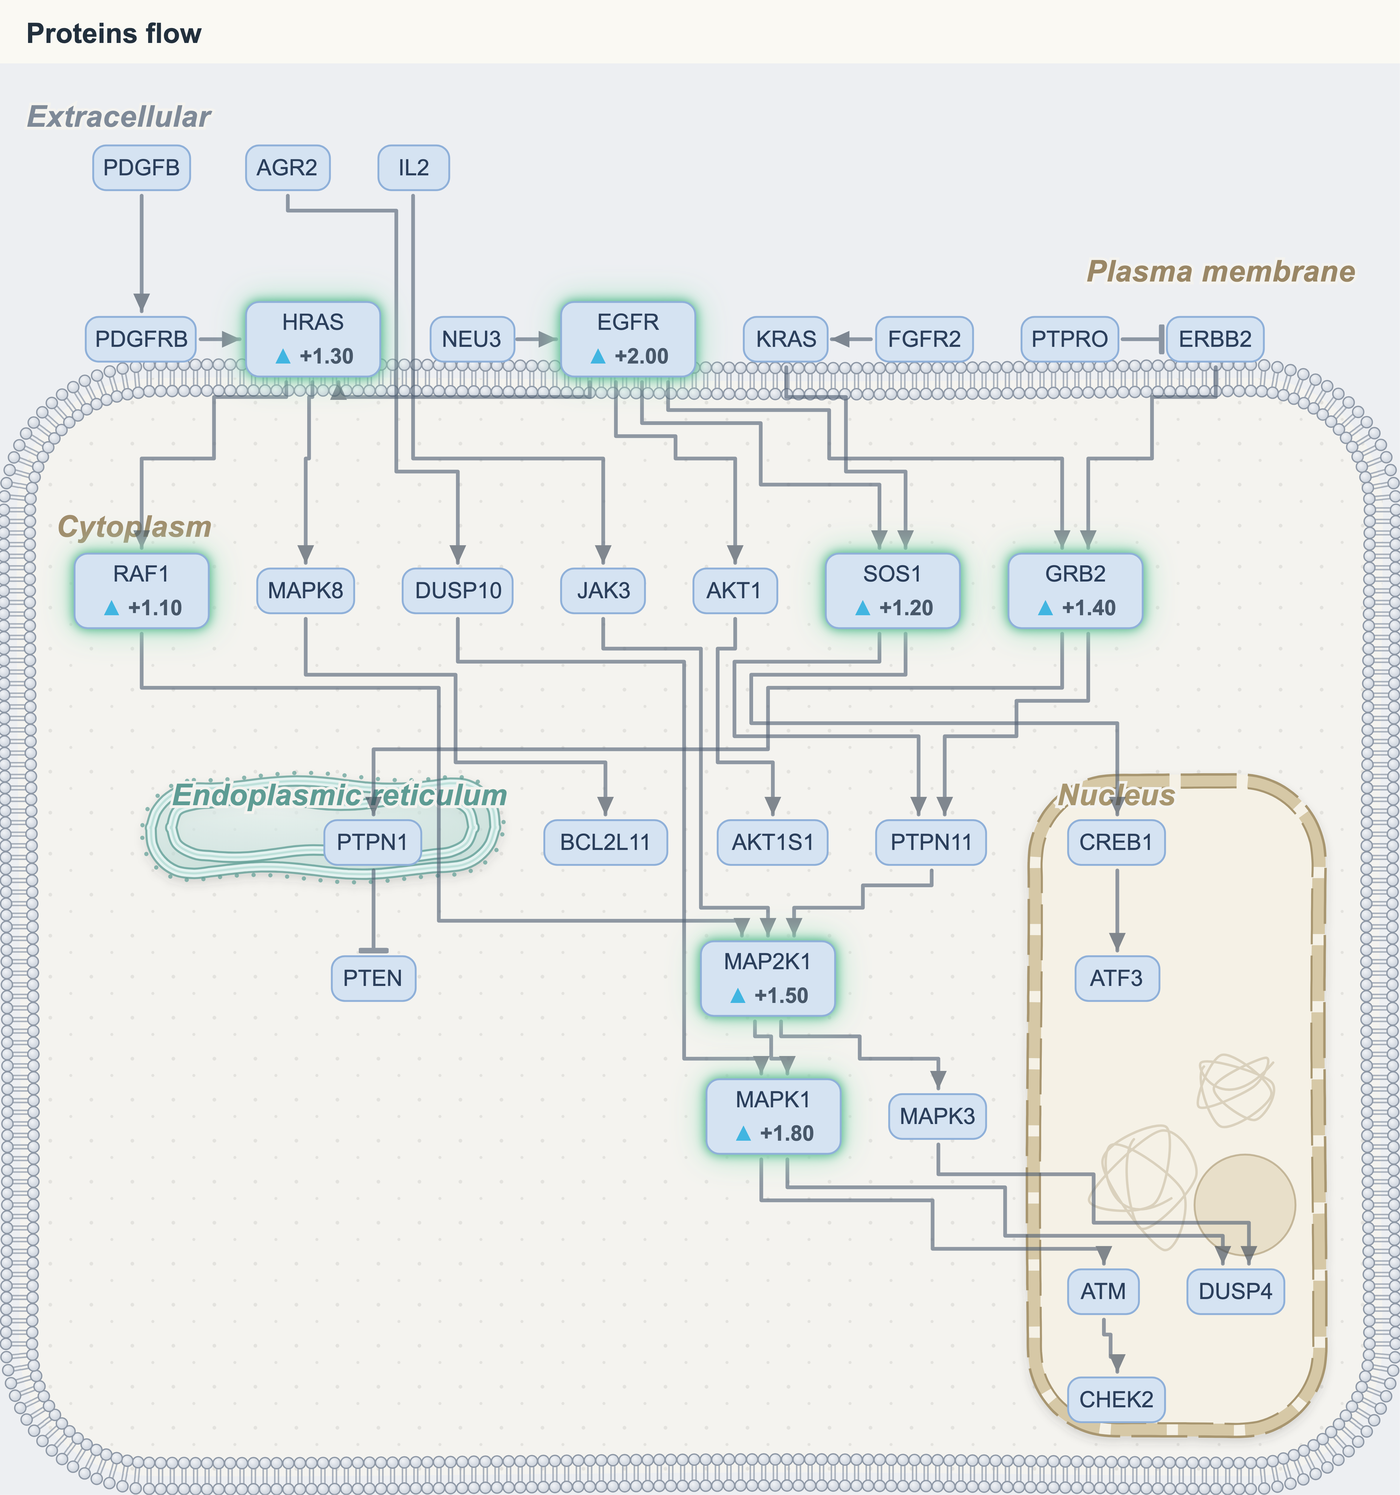
Draws the cascade
Upstream regulators, your molecules and their downstream effects, drawn in their cell compartments with your fold-changes inside the boxes.
Shows the source
Each shown connection links to its paper or book. Where we have it, you can read the sentence it comes from.
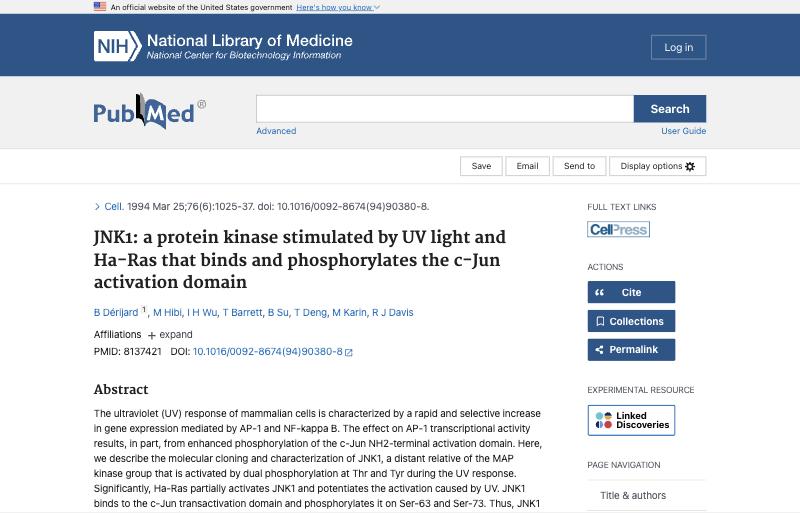
The paper itself
Dérijard et al., Cell 1994: the primary paper behind that arrow, one click away.
For core facilities
A cited cascade your client report can carry. It sits beside your own statistics, not in place of them.
- If you'd like a trial, send us one of your published datasets, or its list of significant molecules.
- We run it through Anvesh and send back the cited cascade and its report.
- You decide whether it is useful for your clients.
Book a 20-minute conversation
Email usPublished or fully de-identified data only, never patient data. We use your data only to prepare your result, and delete our copies within 15 days of sending it. Your data is not added to the Ananta database or sent to any AI service.